This is not so much a real-time tip, but is related to problems I encountered due to the lack of gamma correction on the "Wintel" standard PC. The Apple Mac has always had better gamma correction than the Wintel PC, and with the addition of ColorSync 2.0 to the Apple operating system, color matching is more accurate. Perhaps this is why the Mac is still used so much in desktop publishing where the Wintel PC is attempting to catch up. It is expected that the new Windows 98 and NT Version 5.0 will add some type of color correction (possibly ColorSync) to the Wintel standard PC. My interest in gamma and color corrections is related to some image processing I am doing. In this example, I will show you how to add first order gamma corrections to your image processing programs.
If you want to look at some technical documentation on CRT gamma correction and color, then I suggest you visit the following address and download the technical documents. They are in Adobe Acrobat PDF format.
Charles Poynton - Color technology (or broken link, http://www.inforamp.net/~poynton/Poynton-color.html)
NOTE: the images show here will have slight imperfections in color and resolution due to artifacts introduced by JPEG compression. The ones produced by the programs will be correct.
Adjusting Gamma
First, we need a way to allow the computer operator to adjust and specify the CRT gamma. This is the option dialog I came up with for setting the CRT gamma:
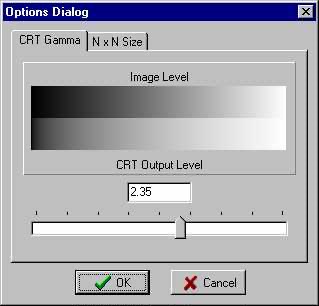
The image is stored internally in linear light levels. This is what you see plotted across the top of the gray scale. To get these levels to come out properly on a CRT we need to adjust the gamma. This is what you see plotted across the bottom of the gray scale. The top grays show little detail near the dark end. Gamma correction brings out the shadow detail. The slider control can be adjusted to integer positions 1 to 400. The following slider event code sets a double precision CRT_Gamma value from the slider:
  CRT_Gamma=TrackBar1->Position*0.01;
  sprintf(buf,"%4.2f",CRT_Gamma);
  Edit1->Text=buf;
  if (Visible) PaintBox1->Repaint();
The gray scale plot is output to a TPaintBox component. The paint event of the TPaintBox uses this code to create the plot:
  int i,r;
  double p;

  PaintBox1->Canvas->Pen->Mode=pmCopy;
  PaintBox1->Canvas->Pen->Style=psSolid;
  PaintBox1->Canvas->Pen->Width=1;
  for (i=0;i<256;i++) {
    PaintBox1->Canvas->MoveTo(i,0);
    PaintBox1->Canvas->Pen->Color=(TColor)((i<<16)+(i<<8)+i);
    PaintBox1->Canvas->LineTo(i,PaintBox1->Height/2);
    p=(double)i/255.0;
    p=pow(p,1.0/CRT_Gamma);
    if (p<0.0) p=0.0;
    if (p>1.0) p=1.0;
    r=p*255.99;
    PaintBox1->Canvas->Pen->Color=(TColor)((r<<16)+(r<<8)+r);
    PaintBox1->Canvas->LineTo(i,PaintBox1->Height-1);
  }
As you can see, the gamma correction is a inverse power function. If you read the gamma specifications from the Poynton reference, you find that most CRTs have a gamma of around 2.2. We need to invert this value to 0.45 in the power function to generate the correction gamma function. Think of the variable i as being the linear light level. The first assignment to the variable p will scale the 0 to 255 levels to 0.0 to 1.0 in floating point. The gamma equation is then calculated which converts the input level to a display level between 0.0 and 1.0. We limit the result to avoid out of range problems. The result is then converted back to the 0 to 255 range for output to the screen.
You may wonder why I used 255.0 to convert 0 to 255 to the range 0.0 to 1.0 and later used 255.99 to convert 0.0 to 1.0 to the range 0 to 255. Well, it mostly has to do with a statistical argument. In the conversion from the integer 0 to 255 range to floating point, I wanted an exact conversion. In this case the integer 0 maps exactly to intensity 0.0 and the integer 255 maps exactly to intensity 1.0. On the way back from intensity to integer levels there is a slight problem. We are really converting the intensity range 0.0 to 1.0 to the integer range 0 to 255 and we want this mapping to be equal throughout the range. Due to rounding of the floating result down to the next lowest integer, we get something different. If we use a multiplier of 255.0, the only value where p gives the integer 255 is when p is exactly 1.0. If we use 256.0 we will overflow if p is exactly 1.0. We actually desire a small range of intensity levels from 255/256 to 256/256 to map to the integer 255. Multiplication by the 255.99 factor will pick up 99% of these values (we could make it more accurate by adding a few more 9s but I was lazy today).
Linear Light Level
A linear light level is generally what you see from scientific CCD sensors, provided the electronics are also linear. The charge accumulated on the CCD element, and thus the output voltage, will be directly proportional to the light intensity (except at very low light levels or long exposure times). It is also what you will usually see coming out of a desktop scanner when the brightness and contrast settings are at their standard values and no gamma corrections are applied.
Most TV cameras will perform a gamma correction of 0.45 internally so the signal can be sent directly to a CRT. If you use a frame grabber to capture this image you will not have linear light values. Some industrial cameras have a gamma switch that can be set to 0.45 or 1.0, allowing you to select the correction you want. The 1.0 setting gives linear light outputs, provided the frame grabber converts the signal without errors.
One way that you can test a device for linear output is to use a photographic gray scale test strip. You can usually get this at a professional camera shop. The one I have is made by Kodak (Q-14 Color Separation Guide and Gray Scale). This specific gray scale has gray squares calibrated in 1/3 f-stops. Every third gray square is equivalent to 1 f-stop of intensity change. When you scan or capture this gray scale chart you should notice the gray level decreasing to 1/2 of the previous value when you move over 3 squares darker. Here is an example of the first part of this gray scale as it was scanned on an H-P ScanJet 5p scanner with the contrast and brightness set to 125 and no gamma correction (using the non-standard but more accurate DeskScan II software):
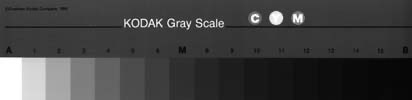
This image will appear quite dark on your screen if you don't have proper gamma correction. If you can save it to disk (right click in MS Internet Explorer) and load it into a photo processing application you will see the level of the brightest square (on the lower left with A above it) is 255 (or K=0%). The third one to the right of it (with 3 above it) should read around 128 (or K=50%). The third one to the right of that one (with 6 above it) should read 64 (or K=75%). If you examine the actual values from this image you will see that the H-P scanner doesn't do too bad a job of scanning this gray scale to linear light values.
It is desirable to store all your images in linear light values. The H-P scanner will allow you to perform a calibration for scanning images to a printer or the screen. The problem with these images is that they will only look correct on the device they were calibrated and scanned for. Most industrial or scientific applications need to work with linear light values. The software should convert them to the proper gamma value for your display. Printer drivers should convert them to the proper ink density for output to a printer. This is the whole idea behind color correction software, a complete subject in itself. If the image is stored in linear light values, software such as Adobe Photoshop can do a gamma conversion on it for whatever use you need.
I once had to calibrate some images input with a B&W camera through some RGB filters. I used the Kodak gray scale sheet for calibration. It involved some second order polynomial fitting functions to get the curves to come into agreement over the complete 8-bit light intensity range. Even then, the colors were not accurate (possibly because the filters were not accurate). You should hope that you never need to write color calibration software. In most industrial and scientific applications we are more interested in making sure the input signals are linear.
Gamma Equation is First Order
The gamma equation I am using is a first order approximation to the actual one used by the broadcasting industry (see the Poynton reference above). The true gamma equation has a short linear segment at the darkest levels. The power curve I have used has infinite slope at zero and will over adjust the lower and middle gray levels. The proper equation for adjustable gamma levels is not given in the reference, possibly because the one given for the fixed 2.22 gamma adjustment was determined by trial and error. It would take some assumptions and playing around with some math to come up with a formula for the general case. For our use the first order equation will need to do the job, even if it over adjusts the gamma slightly.
Another point about gamma: the gamma correction should be reversible. If we adjust the linear light values by 2.22 for display we should be able to adjust the display values by 0.45 (or exactly 1.0/2.22) to get back to linear light. If we calculate everything using floating point, it is, but with conversions to integer, it isn't. If you run this experiment you will find that your integer intensity values will be slightly modified. Also, the dynamic range will be reduced from 8 bits to about 7 bits by this process. This is why it is important to store images in only one format (linear light) and do the conversion only once in one direction as needed for the display or printing device. This also explains how you can lose one bit of precision by using a low cost video camera for input.
Adjusting the CRT Brightness and Contrast
The Poynton reference gives some helpful information on how to properly adjust your CRT brightness and contrast for proper viewing. However, it doesn't give you a reference or image that allows this to be easily done. I decided to create a form with a gray scale image that could be used to set the values. Here is the calibration display I came up with.
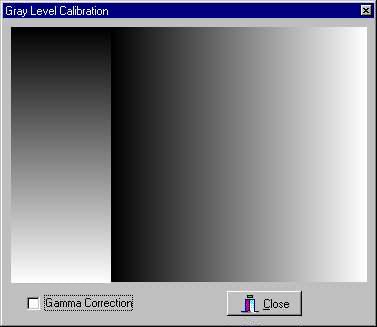
The first version above is without gamma correction. You would use it if your application is not able to apply gamma corrections to images. The next version is with gamma correction turned on. You would use it to adjust your CRT if the application can adjust the gamma.
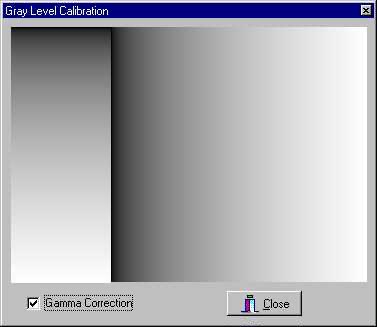
You will see a line between the gray scale on the left and the one on the right. The idea is to adjust your contrast so that the line is just visible all the way to the top of the image and then back the contrast off a small amount. The contrast control actually sets your dark point. If you set it too high, your shadows will have a little white mixed into them because the CRT gun will not be completely shut off. If you set it too low, your shadows will be too dark and have no detail (the usual case on the Wintel PC).
The following code will generate these images:
  int r,c,r0,r1,c0,c1;
  int b;
  double p;

  c0=0;
  c1=PaintBox1->Width-256;

  for (r=0;r<256;r++)
  {
    if (GammaBox->Checked)
    {
      p=(double)r/255.0;
      p=pow(p,1.0/OptionsDialog->CRT_Gamma);
      if (p<0.0) p=0.0;
      if (p>1.0) p=1.0;
      b=p*255.99;
    }
    else b=r;
    b=(b<<16) | (b<<8) | b;
    PaintBox1->Canvas->Pen->Color=(TColor)b;
    PaintBox1->Canvas->MoveTo(c0,r);
    PaintBox1->Canvas->LineTo(c1,r);
  }

  r0=0;
  r1=PaintBox1->Height-1;

  for (c=0;c<256;c++)
  {
    if (GammaBox->Checked)
    {
      p=(double)c/255.0;
      p=pow(p,1.0/OptionsDialog->CRT_Gamma);
      if (p<0.0) p=0.0;
      if (p>1.0) p=1.0;
      b=p*255.99;
    }
    else b=c;
    b=(b<<16) | (b<<8) | b;
    PaintBox1->Canvas->Pen->Color=(TColor)b;
    PaintBox1->Canvas->MoveTo(c+c1,r0);
    PaintBox1->Canvas->LineTo(c+c1,r1);
  }
Adjusting CRT Color
Proper adjustment of color is way beyond what I care to discuss in this short topic. However, if you get the gamma adjusted correctly, then the color should be reasonable too. Here are some color test forms I created. The first one doesn't have any gamma correction. All the colors you see here are fully saturated. The top colors should be fairly accurate because they are simple combinations of red, green and blue.
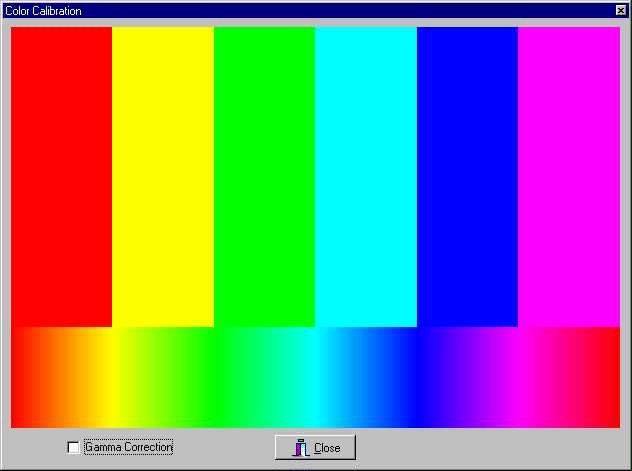
However, the bottom strip of rainbow colors is not very accurate. It is created by adding one color to another and then decreasing the first color. For example, the sequence from red to green is full red at the start, green is then added until yellow is reached and then red is decreased until green is reached. If you view these on a HSB color wheel, the Hue angle goes from 0 to 360 across the bottom. The thing you will notice about this rainbow of non-gamma corrected colors is that the primary colors dominate. There is not really much color range in the transition region between primary colors. The secondary colors are narrow. Without gamma correction, the primary colors tend to go from full off to full on quite rapidly.
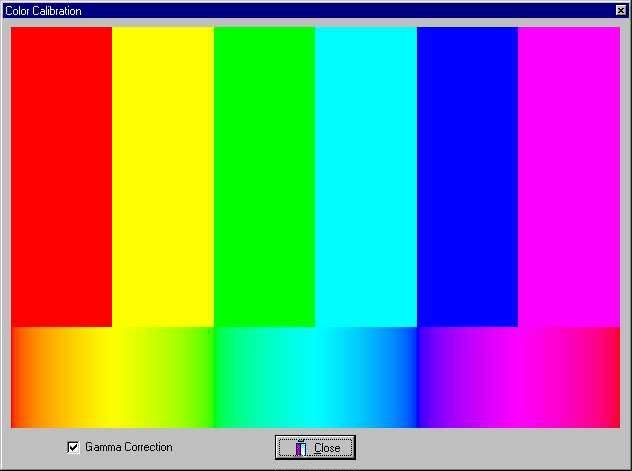
The next calibration form is with gamma correction turned on. You will notice much more detail in the rainbow of colors at the bottom of the form. If you scan the Hue value with the eye dropper in Photoshop you will notice that it is not linear across the rainbow. It is linear on the image above.
This code was used to paint these color test forms:
  int i,c,r0,r1,c0,c1;
  double d,p;
  TColor b,bp,bm;
  TColor clr,clrp,clrm;
  // clGreen color constant is incorrect
  TColor cRed=(TColor)0x0000FF;
  TColor cGreen=(TColor)0x00FF00;
  TColor cBlue=(TColor)0xFF0000;
  TColor cBlack=(TColor)0;
  TColor cWhite=(TColor)0xFFFFFF;

  r0=0;
  r1=PaintBox1->Height*3/4;

  for (i=0;i<6;i++)
  {
    switch (i) {
      case 0:
        b=cRed;
        break;
      case 1:
        b=cRed+cGreen;
        break;
      case 2:
        b=cGreen;
        break;
      case 3:
        b=cGreen+cBlue;
        break;
      case 4:
        b=cBlue;
        break;
      case 5:
        b=cBlue+cRed;
        break;
      default:
        b=cWhite;
    }
    c0=i*PaintBox1->Width/6;
    c1=(i+1)*PaintBox1->Width/6;
    PaintBox1->Canvas->Pen->Color=b;
    for (c=c0;c<c1;c++)
    {
      PaintBox1->Canvas->MoveTo(c,r0);
      PaintBox1->Canvas->LineTo(c,r1);
    }
  }

  r0=r1;
  r1=PaintBox1->Height;

  for (i=0;i<6;i++)
  {
    switch (i) {
      case 0:
        b=cRed;
        bp=cGreen;
        bm=cBlack;
        break;
      case 1:
        b=cGreen;
        bp=cBlack;
        bm=cRed;
        break;
      case 2:
        b=cGreen;
        bp=cBlue;
        bm=cBlack;
        break;
      case 3:
        b=cBlue;
        bp=cBlack;
        bm=cGreen;
        break;
      case 4:
        b=cBlue;
        bp=cRed;
        bm=cBlack;
        break;
      case 5:
        b=cRed;
        bp=cBlack;
        bm=cBlue;
        break;
      default:
        b=cWhite;
        bp=cBlack;
        bm=cBlack;
    }
    c0=i*PaintBox1->Width/6;
    c1=(i+1)*PaintBox1->Width/6;
    d=c1-c0;
    for (c=c0;c<c1;c++)
    {
      clrp=255.99*(c-c0)/d;
      if (GammaBox->Checked)
      {
        p=(double)clrp/255.0;
        p=pow(p,1.0/OptionsDialog->CRT_Gamma);
        if (p<0.0) p=0.0;
        if (p>1.0) p=1.0;
        clrp=p*255.99;
      }
      clrp=bp & ((clrp<<16) | (clrp<<8) | clrp);
      clrm=255.99*(1.0+(c0-c)/d);
      if (GammaBox->Checked)
      {
        p=(double)clrm/255.0;
        p=pow(p,1.0/OptionsDialog->CRT_Gamma);
        if (p<0.0) p=0.0;
        if (p>1.0) p=1.0;
        clrm=p*255.99;
      }
      clrm=bm & ((clrm<<16) | (clrm<<8) | clrm);
      clr=b+clrp+clrm;
      PaintBox1->Canvas->Pen->Color=clr;
      PaintBox1->Canvas->MoveTo(c,r0);
      PaintBox1->Canvas->LineTo(c,r1);
    }
  }